DESCRIPTION
The Transformation Map Method is a synthetic storytelling framework in which you map out the stages of a transformation: starting from the current status and challenge, through intervention(s), obstacles, breakthroughs, and ultimate transformed state (including ripple effects). The story becomes a journey, showing how the protagonist (person, product, organization, project) moved from “before” to “after”, with all the ups & downs.
The USP is that it gives structure + emotional trajectory and audiences are moved not just by success, but by seeing the process, the struggle, the authentic changes on a single page (or just a few). That fosters credibility, inspiration, trust, and connection and its helps building the base to reveal not just what changed, but how, why, and what it took, which adds depth and authenticity. This method tends to be used in case studies, impact storytelling, marketing narratives, leadership and change management communication an almost regular base.
ORIGIN
As in most other cases, this method is a mix of various well working visual storytelling approaches.
The idea appears in nonprofit storytelling frameworks (e.g. “Transformation Arc”) where stories are structured in phases: Challenge → Intervention → Struggle → Breakthrough → Future Vision. It also appears in thought leadership and content-strategy discussions as mapping the journey from “current state” to a “desired state” including milestones, obstacles, decision points visually. So origin is diffuse: many practitioners & frameworks use “mapping transformation” or “transformation arc”, but this dedicated approach is created by story53 to visualize complex (ad long) transformations with the main messages in an easy understandable way linke a poster, animation or an one pager.
USED BY
All units or responsible persons transitioning complicated and or complex processes to a simple visualization.
Approximately needed time
- Step 1: 2 hours
- Step 2: 2 hours
- Step 3: 1 hours
- Step 4: 2 hours
- Step 5: 2 hours
- TOTAL: 9 hours
METHOD
MATERIAL YOU COULD NEED: Whatever helps to visualize: Flipcharts, whiteboards, large paper sheets, markers, sticky notes for mapping stages, milestones, visual mapping tools or templates (journey map, timeline, flow-chart). But also the data and other evidence (metrics, testimonials, outcomes) to support “before / after / result” parts, it’s based on. And if you’re lucky and it exists: Interview and real story inputs of firsthand of struggle, change, insights.
STAKEHOLDER GOOD TO KNOW: People with lived experience (who can speak to the struggle, interventions, transformations), marketeers and visualizers liek graphic designers and post production artists. An additional plus would also be possible external stakeholders and customers, if their voice or feedback adds authenticity.
STEPS
one
0%CONTEXT STATE
To make transformation meaningful to everyone, the audience must understand where things are now, what’s wrong or what need or gap exists. If the starting point isn’t clear, the rest of the map has no contrast and the transformation loses emotional impact. Describe in impactful detail the current situation: constraints, pains, what isn’t working, what’s at stake. Use concrete metrics or anecdotes.
Contextualize: what is the external environment or the causes outside one’s control and what are internal factors (culture, resources, etc.). Be emotionally specific: what is felt, what frustrations exist, why it matters to stakeholders. You can work with post-its and discus clusters and mappings or create charts with data.
Example: A nonprofit mapping story: “Before our program, community health clinics had unreliable electricity, children couldn’t get vaccine refrigeration and staff wanting to make a difference were demoralized because many patients traveled long distances for basic care.”
two
0%INTERVENTIONS (?)
To show what actions or initiatives were taken, when, which turning points. Map milestones to give structure, show progress and give credibility. It helps audience see that change is possible and understand the path.
List the interventions and efforts that were applied: project launches, partnerships, new policies, product changes etc. and identify specific milestones and markers of progress (e.g. first pilot, first metric improvement, rollout, scaling) as you will visualize them in the transition to visuals. Note decision points: times when choices were made that shaped direction and times of uncertainty.
Example: The nonprofit: “We installed solar units in two clinics by month 6 by hiring local technicians and volunteer community training. We measured decreasing vaccine spoilage due to optimization (show some numbers to underline that statement) and will then expand to 10 clinics by year 2.”
three
0%VISUALIZED AND CHARACTERIZE
Visualized struggles makes transformation believable and meaningful. If you only show the ‘good parts’, the audience may see it as glossed-over, promotional. The struggle gives tension, authenticity, helps people connect & root for the outcome. Identify internal and external obstacles, resource constraints, resistance, unintended consequences, policy issues etc. and describe how these were dealt with (failed efforts, what was learned). show that persistence, adaptation was required and maybe show small setbacks.
Example: “During rollout, many solar units failed under local heat/humidity. Supply chain delayed panels and community resistance raised because of maintenance concerns. We had to revise design, retrain staff, overrun budget, etc.”
four
0%BREAKTHROUGHS (!)
This is the emotional payoff. The moment(s) when change becomes visible, outcomes are realized and this is what inspires, persuades, convinces the customer or employee and it also provides proof. Show observable change: metrics, stories, testimonials. What is now better.
Highlight how lives, systems, users are different. Include qualitative + quantitative evidence. Highlight turning point(s): what changed to allow breakthrough (e.g. shift in strategy, innovation, mindset).
Example: “After 2 years, vaccine spoilage dropped from 35% to 5% and patient visits increased by 60%. Staff morale improved and the community reports greater trust. Clinic uptime near 95% etc.”
five
0%VISION THE FUTURE
A transformational story is more powerful if it doesn’t end at the success point (unless it show a past and finlized transformation for information or documentation purposes) and it points toward what comes next, what further impact or change is possible, what has been learned so it can be sustained and even scaled. It gives hope, mobilizes further action, or invites participation.
Show how transformation can ripple beyond the immediate context: long-term impacts, scaling, policy change, social value and distill key learnings: what made success possible, what could be done differently, what investments are needed. Make sure to include a call to action or implication for audience: what they can do or what next steps exist, but also how to replicate it to be successful too.
Example: “We plan to expand to 50 clinics over next 3 years and leverage solar-powered clinics for education materials. We plan to train more local maintainers and use learnings to propose policy change for rural health funding. We invite donors to support maintenance funds.”
visual
0%What sound easier?
The description:
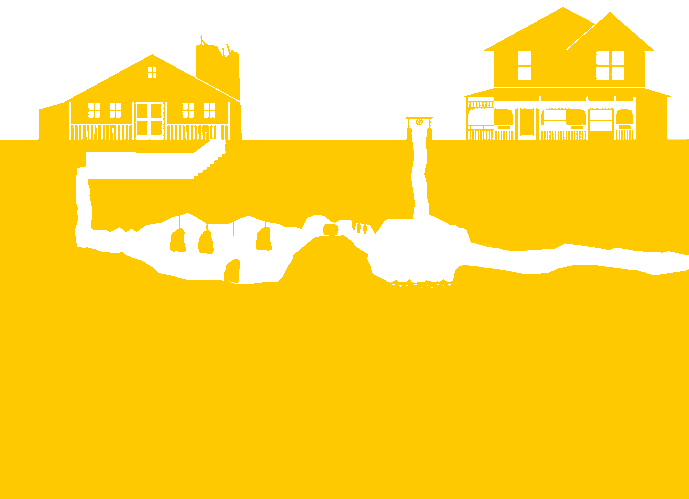
- Discover the old doubloon and line it up with landmarks on the coast.
- Spot the old, creepy restaurant near the cliffs.
- Go inside and sneak into the basement.
- Find the hidden trapdoor and fake fireplace.
- Crawl through the fireplace opening into a dark tunnel.
- Climb down the ladder into the tunnels below.
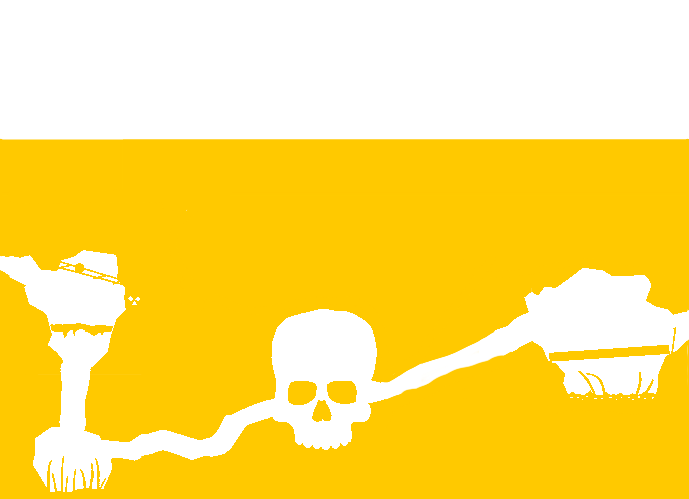
- Follow the map through narrow passages and dripping caves.
- Trigger and dodge several booby traps along the way.
- Use the bone organ to open the next passage.
- Slide down the long water chute deeper underground.
- Land in a huge cavern with underground pools and rocks.
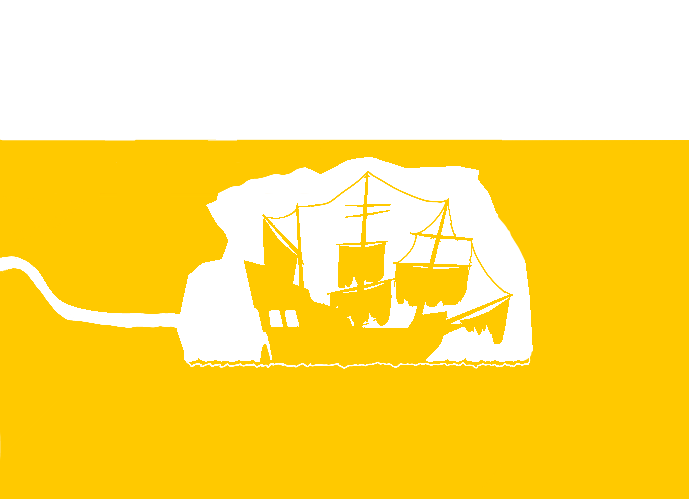
- Discover One-Eyed Willy’s massive pirate ship, the Inferno.
- Climb aboard and find the treasure.
- Escape through the tunnels.


add
0%The “Transformation Arc/Journey/Map” approach is widely used by nonprofits and impact storytellers.
E.g. Nonprofit Storytelling Framework: Map the Transformation Arc as they allocate percentages of the story to different phases: Challenge (≈25 %), Intervention (≈15 %), Struggle (≈20 %), Breakthrough (≈25 %), Future Vision (≈15 %) of the narrative.
In thought leadership & content strategy, mapping the (potential) transformation journey ensures content isn’t just aspirational but credible (showing obstacles etc.). It’s crucial to balance emotional + factual evidence, but avoid over-simplifying struggle or glossing over challenges, or else story loses credibility. It can(should be combined with visuals: journey maps, timelines, transformation maps, infographics etc., to help audience follow more easily.